
In the first of a regular broker/valuation round up, Craig Jallal from VesselsValue.com looks at key trends from the first three months of 2016.
Brokers offer broadly two explanations for the drop in secondhand sales in the first quarter of 2016; first, there are no ‘real’ buyers out there, and second, the market is one of the worst in living memory. In the case of the latter, there are those still in the shipping industry that recall the early 1980s, when newbuildings left the shipyards and went straight into lay-up, and the percentage of surplus fleet capacity was in double figures. We should all be thankful that the market is still some distance from that point. With regards to the former, ‘real’ buyers are those with the readily available funds and a track record of being committed buyers.
An analysis of ship sales shows that 42 fewer vessels (comprising bulkers, tankers, containers and LNG and LPG gas carriers) were traded in Q1 2016 compared to the last quarter of 2015. The year-on-year comparison of the first quarter (2015 vs 2016) reveals a decrease of 45 ships. However, within certain highly stressed sectors, tumbling prices led to an increase in purchase opportunities and a subsequent increase in sales in the first quarter of 2016. In the capesize sector, 25 vessels more (a 500% increase) were sold in the first quarter of 2016, versus the same quarter of 2015. In value terms the increase was even more impressive, at $105m in Q1 2015 versus $706m in Q12016. Other heavily traded sectors included supramax (six sales in Q1 2015 versus 29 sales in Q1 2016), and panamax bulkers (17 sales in Q1 2016 versus 28 sales in Q1 2016).
The changes in values in the first quarter of 2016 are nicely illustrated in the changes in values in the VV Matrix, produced by VesselsValue. The largest decline, according to the VV Matrix, was in the values of 15-year old panamax bulk carriers, which dropped by 29% between January 1 2016 and March 31 2016.
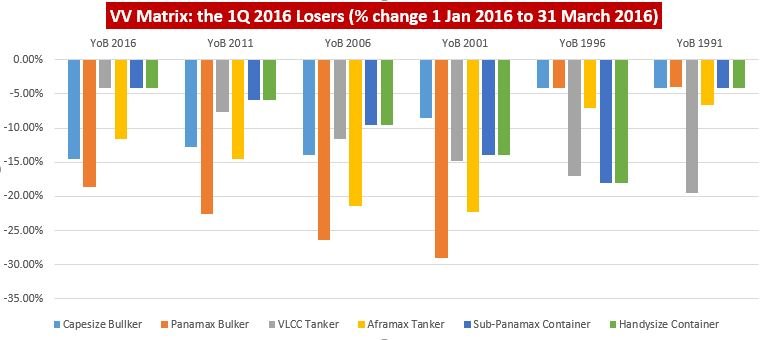
Older aframax tankers also became significantly less desirable, with the VV Matrix recording a 22% drop for 2001-built vessels falling outside the unofficial oil major age cut-off. The chart of % changes highlights the sectors that suffered the steepest falls in values, but a bright spot in the market was the feedermax container sector, where resale values were observed to increase by 10%, and units already in the water also showed growth in values of between 2% and 9% depending on age.
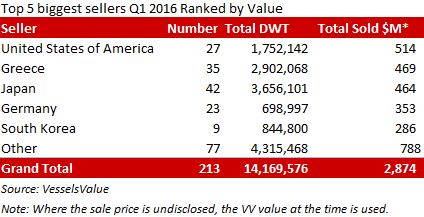
The VV Matrix is driven by observed sales of bulkers, tankers and containers, and VV recorded 213 sales in Q1 2016 with a value of $2.8bn. Shipowners in the US sold 27 vessels, and due to the influence of the Jones Act on US-flag vessels, these had the highest aggregate value. However, Greece and Japan led the ‘international’ sales.
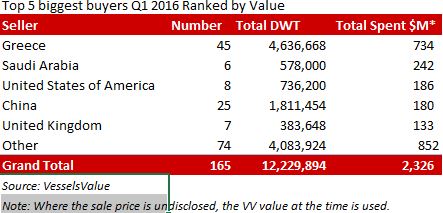
The dire dry bulk freight market has been a major driver in ship sales and one publically-listed company has divested itself of over 1m dwt of tonnage. As mentioned above, Greek buyers purchased the most ships in terms of numbers and in terms of value.
Looking ahead, will values continue to fall in 2016 and where will the bargains lie? Looking at capesize vessels first, the VV Fixed Age Fan Chart for capesize vessels produced by VV (part of the VV+ module) shows the current values for all capesize age ranges. These values currently rest on the lowest 10% of observed sale prices. For instance, current five-year old capesize values are substantially below the median level of observed sales and in the lowest decile of the same. Therefore, capesize values appear to be at bargain levels, and it is expected the volume of sales in this sector will continue in 2016 as long as there are ‘real’ buyers in one of the most distressed markets in living memory.