
A new online comparison tool will give investors a more transparent look at listed dry bulk shipping companies, writes Anders Liengaard.
When evaluating the performance of an organisation regular methods include mark to market performance as well as performance against peers. However, in dry bulk shipping this exercise has proven difficult in the past because of either lack of information available or non-standardised reporting methods.
As an observer, it is interesting to see how listed dry bulk shipping companies for years have been able to simplify their reporting methods to a degree which can be directly misguiding for the recipients.
The most common used phrase could be something like “….outperforming the Baltic Index by 13 percent”. That’s all very fine, but it is worth keeping in mind that the Baltic Indices are produced on the back of a standard index vessel for each segment. This means that unless a normalisation (normalisation means adjusting values measured on different scales to a common scale) of a given fleet is being conducted, a direct comparison is like comparing apples with oranges.
So, while we are awaiting Q2 results from some of the prominent listed dry bulk companies, let’s take a look at some Q1 2018 results.
For the purpose of simplicity, two companies active in the same size shipping segment namely Pacific Basin Shipping and Scorpio Bulkers have been chosen. Both companies have similar sized supra/ultramax fleets of bulk carriers and both have reported their earnings for Q1.
From information available in public Q1 reports, we can read that Scorpio Bulkers has reported following earnings:
Ultramax daily time charter equivalent (TCE) usd 9,757/day.
Pacific Basin reported their earnings as follows:
Supramax daily time charter equivalent (TCE net) usd 11,250/day.
Looking at the Baltic Supramax Index (BSI) the average between January 1 to March 31 2018 was $10,729 per day. This is however a gross figure and the net figure (deducting 5%) is $10,192 a day. Assuming that Scorpio Bulkers has reported their earnings in net figures the numbers show that compared with the market they seem to have underperformed the BSI index by $435 a day whereas Pacific Basin seem to have outperformed the index by $1,058 a day (see table 1).

But the comparison shouldn’t stop here!
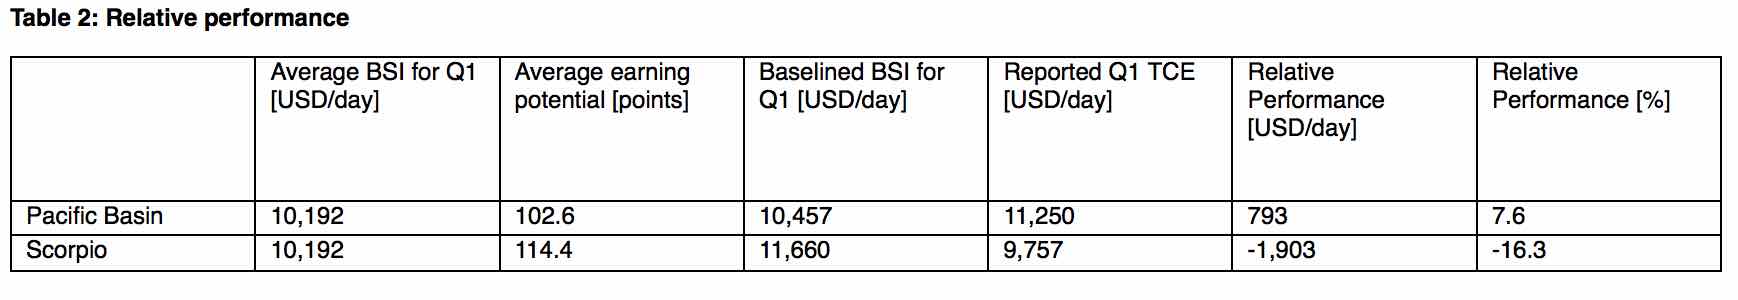
Relative performance
As indicated earlier, normalisation of the respective fleets must be considered in order to form a common baseline. Only by having a common baseline, can we evaluate the relative performance of dry bulk companies. Or in other words compare apples with apples.
The BSI index is based on a standard ‘Tess 58’ meaning a Japanese Tsuneishi built 58,000 dwt ship. The fleets of Pacific Basin and Scorpio Bulkers consist of many different ship designs with various potential earnings capacities. Without normalising the earning capacity of these fleets against the BSI Tess 58 it would be like comparing apples with oranges.
Using the newly launched and independent online tool VesselIndex.com, we have baselined the core fleet of both companies. The methodology behind VesselIndex is acknowledged by industry players and taking the vessels primary earnings features into account. These earning features are deadweight capacity, cubic capacity, draft and speed & consumption.
Looking at Pacific Basin the core fleet of 35 supramax vessels have an average earning capacity of 102.6 index points against the BSI Tess 58. This effectively means that the performance of the Pacific Basin supramax fleet in Q1 is not $1,058 a day better than the index but ‘only’ usd $793 a day better when looking at normalised figures. This brings their outperformance of the index down to 7.6% against their reported 10%.
Turning to the performance of Scorpio Bulkers, the importance of this exercise becomes even more clear. Scorpio Bulkers themselves emphasise in their Q1 trading update that their fleet is “High specification best-in-class fleet”. This is true in the essence that the fleet’s earning capacity reflects this statement. Looking at their core fleet of supra/ultramax vessels they have an average earning capacity of 114.4 index points against the BSI Tess 58. This means that the performance in Q1 is not $435 a day lower than the BSI but instead $1,907 a day lower. The consequence of normalising the Scorpio Bulkers fleet is that their performance against the BSI goes from an underperformance of 4% to a 16% underperformance (see also table 2).
With VesselIndex, analysts can now comfortably step up the game and base their future analysis and research on relative performance. This will benefit not only those investing in listed dry bulk companies but also help the dry bulk companies themselves to benchmark their performance against their market competitors.
Very helpful. Thank you. Please post more articles like this that shed intelligence on our understanding of the business.
Thanks for this piece. Very useful and in need of further discussion. All best.
THIS IS VERY CLEAR AND PRECISE. WE HAVE SEEN A LOT OF POOL’S GIVING OUT INFORMATION THE SAME WAY AS YOU HAVE ENUMERATED AND ENTICING OWNERS TO PUT THEIR SHIPS INTO THEIR POOLS. THIS WILL MAKE FOR VERY LUCID UNDERSTANDING OF THE STRATEGY USED BY THE POOLS. EXCELLENT PIECE.