Liner congestion spreads across the planet, 304 ships queuing for berth space
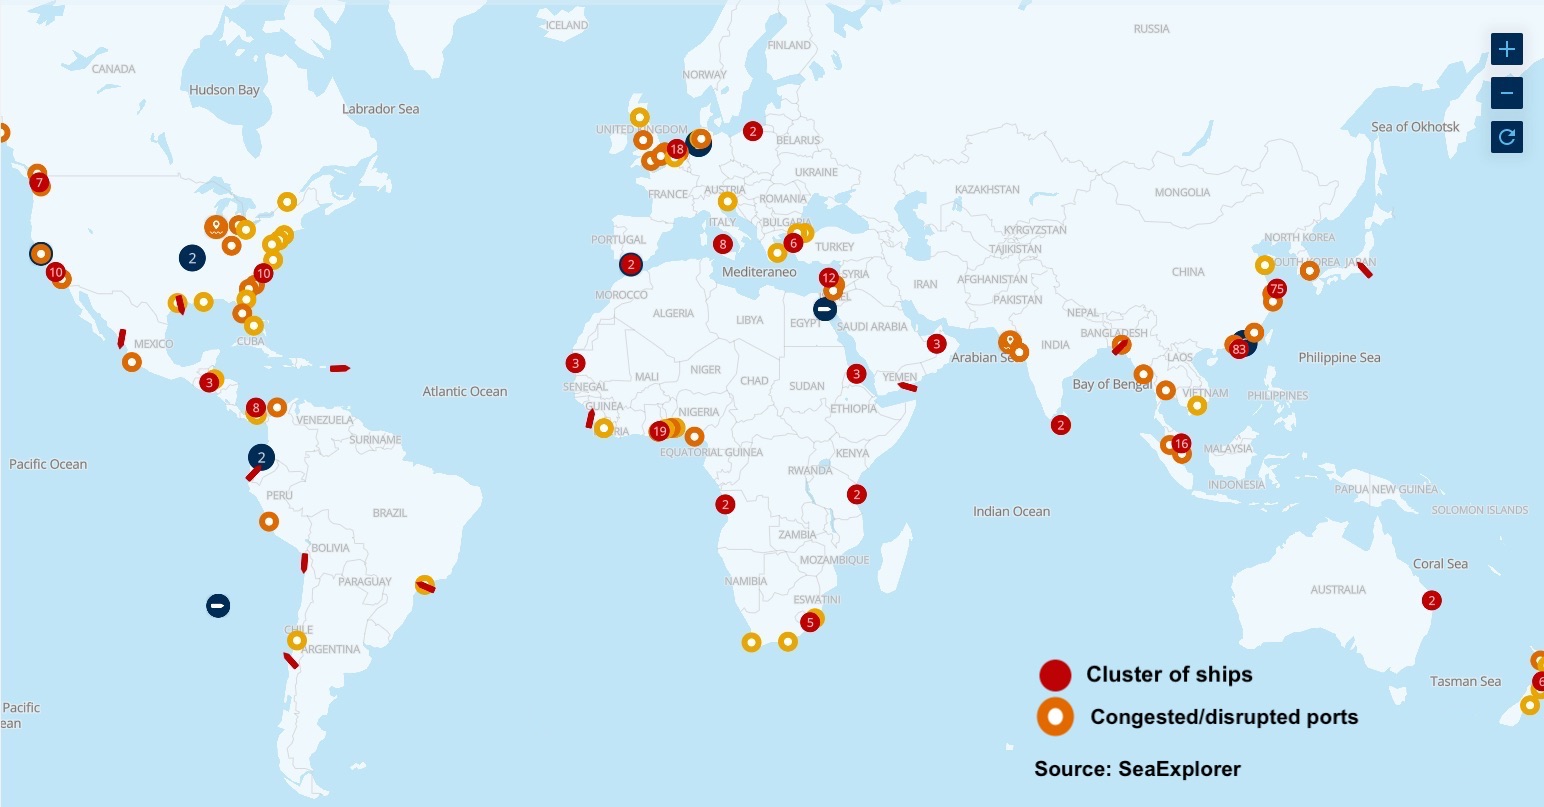
The ebb and flow of record global liner congestion is neatly encapsulated in two maps provided below from Seaexplorer, a container shipping platform created by logistics giant Kuehne+Nagel.
As of 3.30 pm Singapore time today (see top map) there were 304 ships idle in front of ports around the world waiting for berth space to open up. Seaexplorer data shows there are 101 ports reporting disruption such as congestion. Officials at the Kuehne+Nagel digital offshoot report the number of ships forming queues hit 350 in the middle of this week before falling back to 304, the same level as this time last week (see lower map). Red dots in the enlargeable maps represent clusters of ships while orange ones mark out ports that are congested or suffering from disrupted operations.
The clear change over the past week is how the congestion, so visible in recent weeks in south China, a key export area hit by a Covid-19 outbreak, is now spreading to other important hubs. Singapore, for instance, has seen the number of boxships waiting for berth space increase by 37.5% over the past week, while intra-Asia hubs such as Laem Chabang are now reporting tailbacks and in the US, east coast ports are suffering all manner of disruptions.
While last week, boxships queueing in Chinese waters made up more than 50% of the global total, this has dropped today to less than 40% indicating the growing global congestion contagion.
Terminals are becoming global bottlenecks, be it at berths, yards or gating out cargo
Maersk, the world’s largest containerline, in a post from earlier this week discussed the stretched nature of global supply chains, something it warned was now the new normal.
“The trend is worrying, and unceasing congestion is becoming a global problem. Due to Covid-19 and a significant volume push since the end of last year, terminals are becoming global bottlenecks, be it at berths, yards or gating out cargo, and it’s continuing throughout the logistics chain – in the warehouses, the distribution centres – with numbers on the rise,” Maersk stated.
Splash reported yesterday how the partial shutdown of Yantian Port following a Covid-19 outbreak late last month is now on track to affect twice as many containers as were impacted during March’s high profile blockage of the Suez Canal.
Blank sailing data tracked at major Shenzhen ports, including Yantian, by box tracking service project44 has shot up.
Over the period of June 1 to June 15, 298 container vessels with a combined total capacity of more than 3m teu skipped Shenzhen, a 300% increase in blank sailings in one month. Though the total capacity was not meant for Yantian, the volume of loaded export containers that were left behind has caused a severe backlog.
Dwell times at Yantian also paint a grim picture. Over the last two weeks, the seven-day average of median dwell times on export containers from the Yantian terminal doubled in number, reaching 23.06 days on June 15. The mean dwell times on import containers into Yantian were lower, at 5.96 days for the same period, suggesting that carriers are avoiding the port.
“While the epicentre of this particular breakdown is Yantian, these numbers spell trouble across the maritime shipping world, and particularly for companies that rely on these routes,” said Josh Brazil, vice president of marketing at project44. “Even shipments not directly impacted by the Yantian situation could feel the impact, as carriers adjust their networks to avoid congestion at Yantian.”
Hind Chitty, principal consultant at Drewry’s supply chains advisory practice, told Splash: “Carriers are skipping Yantian port in their rotation, creating massive rollovers and multiple side effects, as an additional shortage of empty equipment in the region and an unprecedented surge in the east-west ocean freight rates, which may spread to the other trades lanes.”
Drewry’s World Container Index (WCI), published yesterday, increased 3.4% or $231 this week, and is 305.7% higher than a year ago.
The average composite index of the WCI, assessed by Drewry for year-to-date, is $5,427 per feu, which is $3,468 higher than the five-year average of $1,960 per feu.
The Shanghai Containerized Freight Index (SCFI) also climbed to new highs today, up another 44 points this week to settle on a record 3,748 points with some speculating the extraordinary market forces at play could see the SCFI cross the 4,000 mark soon.