Mr Prospector tries to beat the January blues, as statistically February will be worse.
‘The fun of January’ is a very rare statement, particularly when heard in the shipping markets. How often is January the low point of the year for freight rates? I don’t want to sound discouraging, so probably best that I don’t mention that almost never, and that February, the month of love for most is a time of utter gloom for most owners (it seems nobody loves them). It’s even worse if you love Capesizes, a market that prepares to throw out its positive sentiments like a Christmas tree carcass on a cold winter pavement. Yep, January is a crappy month to be a Capesize owner, but if you want to look on the bright side then hey! It’s not as bad today as it is going to be later in the year! Now we are starting to sound like I’m making a forecast, which I am certainly not, so let’s move on quickly.
I was looking at the components of the Baltic Capesize Index this morning, attempting to gain some inspiration to hammer the keys and write something vaguely interesting for you, but to be honest I have been flat out of inspiration. It was also done so I could avoid unblocking a drain that keeps flooding my garden, which is about the equivalent trade off level between unpleasant domestic job and looking at the freight indices that most people have. One’s a stinking eyesore, the other, yes, yes, too early in the year for that kind of joke. I looked and I looked at these numbers, hoping for something to jump out of the page to get me thrilled and excited. Nothing other than how bad the rates are jumped back at me.
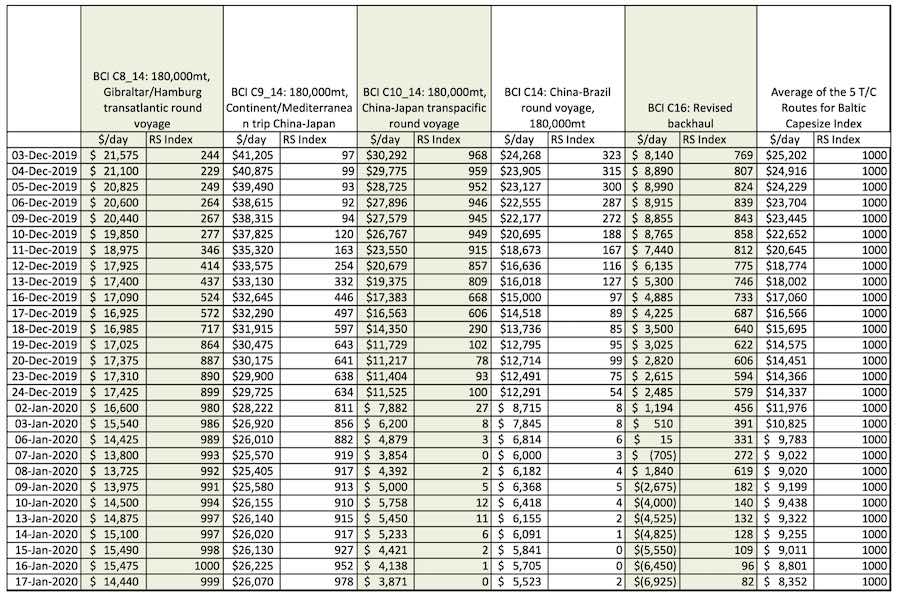
So I decided to have a play around with them and see if there was anything other than ‘it’s a bad market, but it should get better. Trade wars, blah, blah, etc’ to say. Here’s the methodology that I used: take each route and compare it to the average of the 5 TCs over its long-term history (in the case of Capes that is 26 Feb 2014 to date). This gives a picture of the relative strength over time of each component against the rest of the market. This did start to yield some partially interesting data. I’d like to say here that before you start worrying about index weighting, forget it now. I looked into it, it didn’t add anything to this analysis or make much sense so I canned it. If you think it makes a difference I suggest you find somebody else to tell because I ain’t listening.
The Atlantic has taken a severe tumble, so has the trip out, but the Pacific has been hammered like it has never been hammered before. Rates to the naked eye show a TC average that fell from $23,704 on 6th December 2019, to $8,352 on 17th January. Hammered. The interesting part comes when you start to look at the composition of this hammering though. The Atlantic’s relative relationship with the TC average has gone through the roof. In fact, the relative value of the Atlantic and Pacific markets for Capes is at its widest point since, well, since 26 February 2014 when this data could start to be collected.
Putting this into terms that my small brain can manage, I tried another little calculation to order values more easily. I ranked each route’s differential against the 5 TCs index from 0-1,000, with zero being the lowest in the group of results and 1,000 being the highest. This allowed me to look at the ranking of the data and compare. Obviously there are some areas of leeway where a statistician is going to pick apart my attempts to look credible, for example using this method means they can’t all be winners (unlike my son’s sports day), as all of the routes can’t peak at the same time against each other. But if you don’t try to be definitive and just try to see patterns then I think there is a lot of value in, ermmm, relative value.
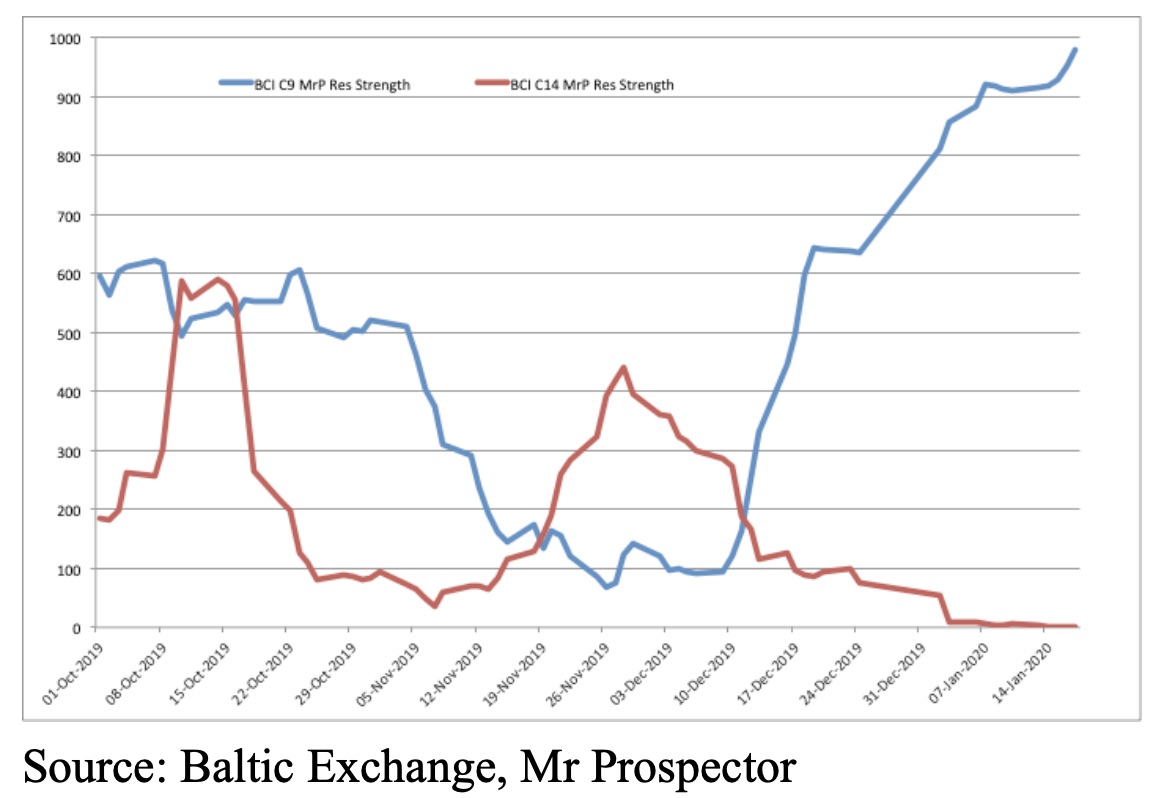
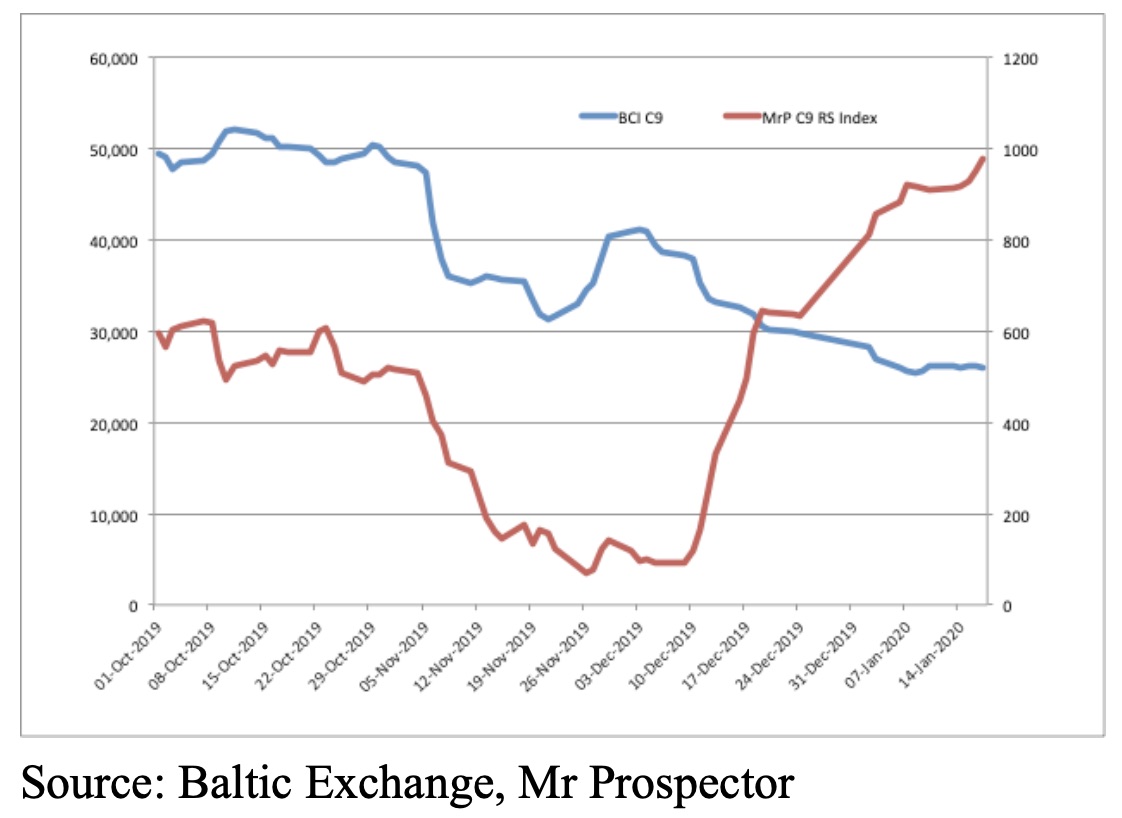
January 2020 then starts to become just a tiny bit more interesting for Capesize enthusiasts. Here we go then: the TA round voyage has been between 980-1,000 for the whole of January, topping out at the maximum reading of 1,000 on 16th January. All time high! Front haul for the same period has been in the low 900s, climbing to 978 on 17 Jan 2020. That means that it has only been higher less than 30 times in the last 1473 index days.
On 22nd November 2019 the TP round voyage was at 974, meaning it too was at a real high point versus the average earnings. Today? All time low. That’s right, it has never been a lower percentage of average earnings than today. And it is not alone as the China/Brazil RV is also at its all time low. Backhaul isn’t exactly great at 82 (out of a possible 1,000). So what we have here is a market that is entirely propped up by the Atlantic.
I had a look back at times when this phenomenon might have been repeated over my data set, where everything in one ocean was rosy and rates in the other were headed for intensive care. The answer is that no, never has there been anything like this before. This is (and I hesitate to use this word) unique. Sure, rates and ratios have ebbed and flowed, but the jump out point is that having a market where the Cont/Med to China is incredibly strong while the China/Brazil RV is incredibly weak has not happened before.
At this point I usually wonder if I am serving up reheated leftovers that all of the experts have already dined on some days before. On this one, I’m pretty sure that is not the case. This looks to be so far at the end of the range spectrum it has to be of interest doesn’t it? What can you do to activate something profitable armed with this knowledge? I wrote out a whole selection of possible things a trader or a charterer or an owner might want to do, but then deleted them. I was recently in County Cork in Ireland, an ancestral visit (to see my granny). I got myself a bit lost and went into a little village pub to ask for directions to a town called Mallow. I was told “Well, you wouldn’t want to be starting from here now”. This pretty much sums up why I deleted the trading tips. Firstly, I have no idea if you are short or long, owner or trader, what your portfolio looks like and what you can actually do. Secondly, and more importantly in my view, if you are faced with extreme market conditions (complete statistical outliers) and need trading tips from a 100-year old gold miner that lives over a chip shop in Scotland then shame on you!
Judging by the volatility of the calculations I’ve made (‘bloody volatile’ I believe is the statistical term of the day), these extreme windows do not last long. So act now, from wherever you may be starting. It turns out that opportunity knocks at the strangest of times. You just need to listen out for it.
You don’t need to outrun a bear, you only need to outrun your friend.
If you fall off the top of a skyscraper you can tell yourself you’re still OK all the way down until you hit the floor.