
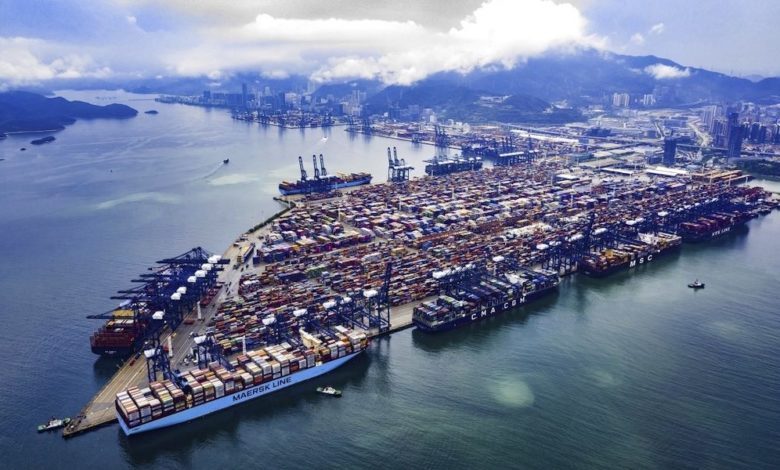
The state of global container congestion continues to roil supply chains right across the world.
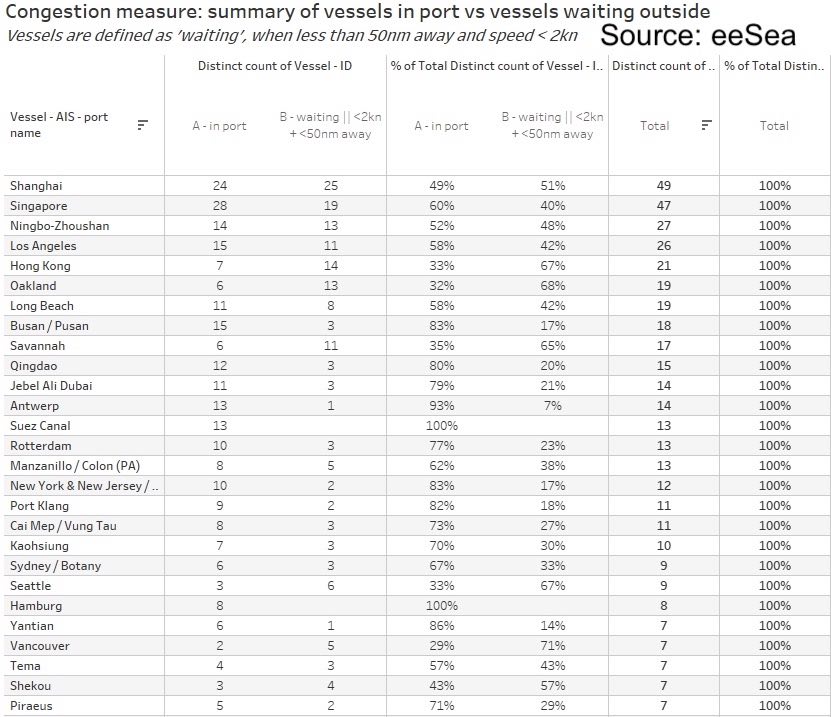
Exclusive data from maritime intelligence service eeSea shows the world’s most congested box spots, ranking all ports by the sum of mainline vessels either in port or waiting. The ratio between in port and waiting is an approximation of the congestion. Hong Kong, for example, has a high waiting ratio of 67%. Oakland, Savannah, Seattle, Vancouver are all above 65%, while Yantian, the scene of a Covid-19 outbreak that hampered productivity throughout June, has done well to clear much of its backlog over the past couple of weeks.
The data is based purely on AIS and covers mainliners, not feeders, something eeSea may add as a function at a later date.
10% of the world’s shipping capacity has been taken out due to port congestion issues
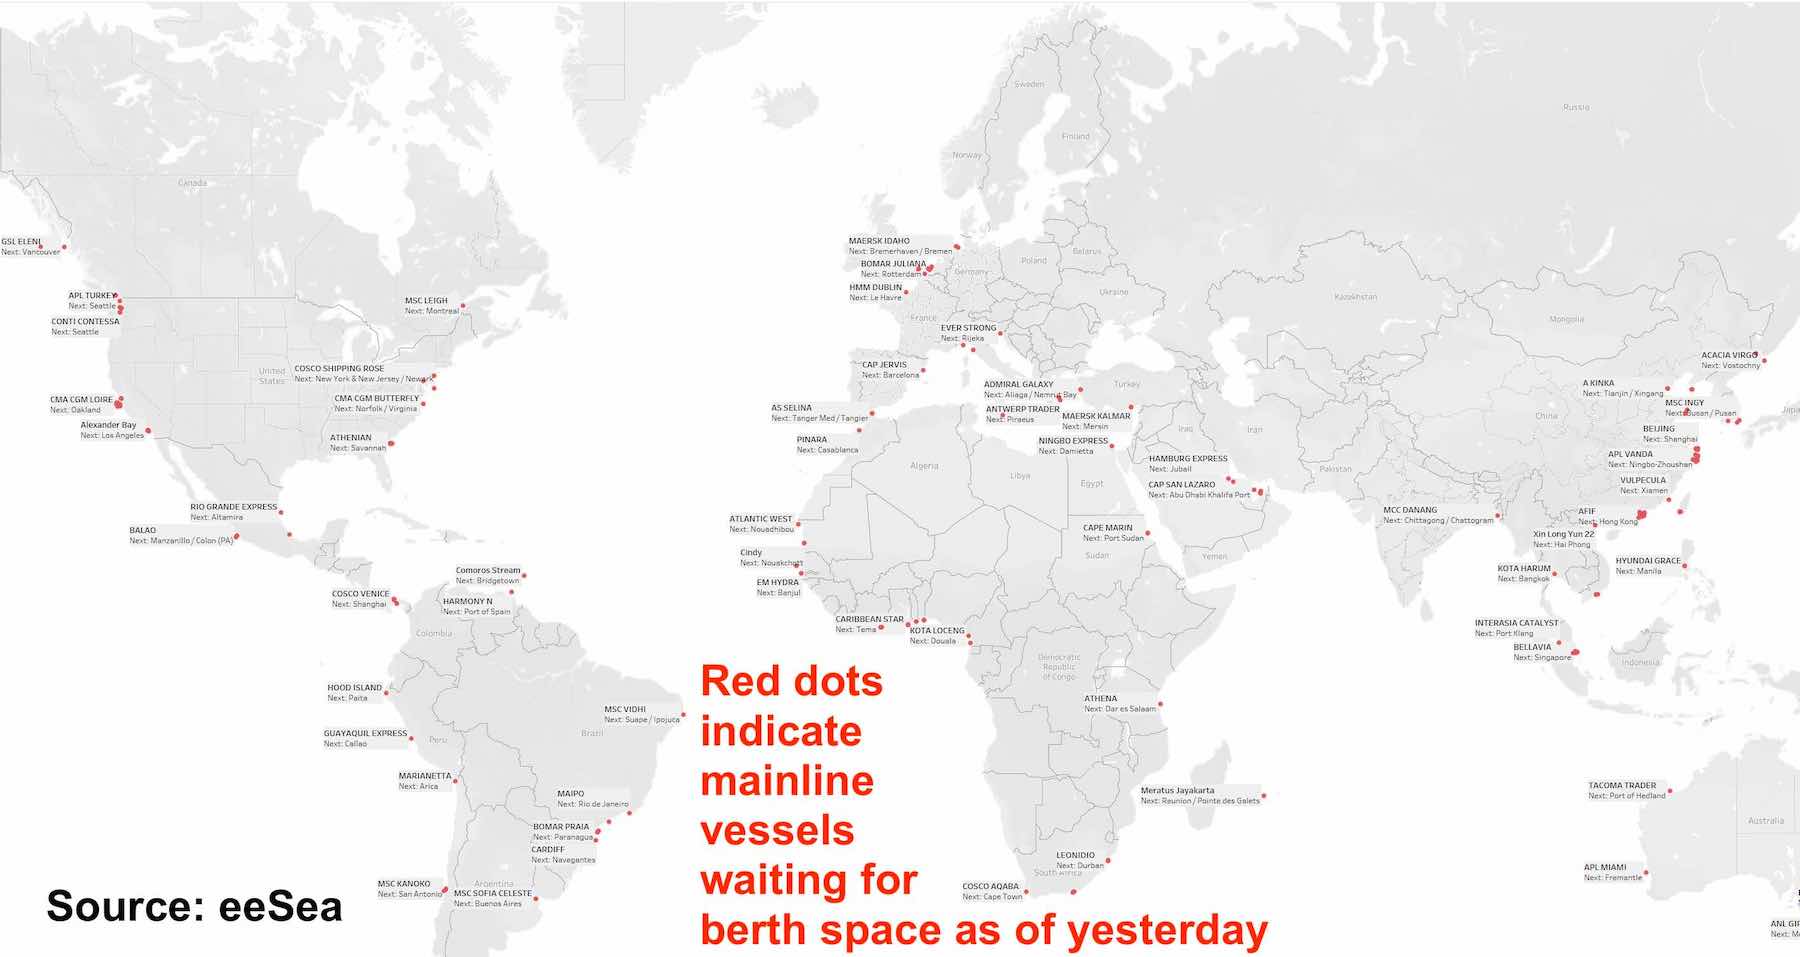
“While feeders do contribute to congestion, they’re usually considered a consequence, not a contributing factor,” explained Simon Sundboell, eeSea’s founder.
Extreme consumer demand, principally in the US, has combined with Covid-19 shipping and port dislocations all year, creating unprecedented congestion across the globe as well as record freight rates and all-time lows for liner schedule reliability.
Lars Jensen, founder of container consultancy Vespucci Maritime, has estimated that 10% of the world’s shipping capacity has been taken out due to port congestion issues.
Thanks for an exceptionally useful article.
We may note that ordering new ships is not always the ideal way to deal with port congestion.
I would question if there is any direct connection between ship orders and port congestion.
On the contrary, more of the bigger ships are part of the causal effect of congestion by concentrating more container inventory on individual ships, which then create even bigger bottleneck congestion at ports which, in turn, have no immediate way to expand capacity or throughput. While ULCVs are not evident on TransPac, the sheer quantity of boxes and ships arriving is already overwhelming many ports – even more ships will not improve this situation. Indeed, more larger ships may create the A380 effect, which only serves to polarise congestion.
More specifically, the principal causes of port congestion (especially in the US) have been the disturbance a reverberating knock-on effects of a stop-start in global manufacturing and then re-stocking, first in China and then around the world, as buying patterns changed. The fact that the flow of containers and ships was interrupted and the circulation of assets was stymied meant that ports suffered what is happening to cities (such as in Liege this week) when a month’s rain falls in one day- they are flooded.
The increased ship orders are a reaction to a variety of factors, such as increased cash flow, a dearth of earlier new (postponed) orders, renewing the tonnage age profile, the need to keep up to date with technological advances and legislation, keeping up in the ‘space race’ and many more factors.
As Anne Robinson would have said……
”Welcome……to the weakest link……”
Good read but your report doesn’t have figures for india and sub cont..we are also leading contributor in trade..