
New teu waiting days indicator highlights the severity of global container congestion
Logistics giant Kuehne+Nagel has developed a new key performance indicator (KPI) which underscores today’s super-stressed container shipping situation.
Kuehne+Nagel’s digital platform seaexplorer has developed a unique Global Disruption Indicator, which tallies the cumulative teu waiting time in days based on container vessel capacity in disrupted hot spots. The specific hot spots covered include Los Angeles, Long Beach, Seattle, Vancouver, Prince Rupert, Oakland, New York, Savannah, Hong Kong, Shenzhen, Shanghai, Ningbo, Rotterdam and Antwerp.
North American ports are responsible for approximately 80% of global disruptions
The teu waiting days (TWD) indicator works whereby, for example, one vessel with a 10,000 teu capacity waiting 12 days equals 120,000 teu waiting days.
As of yesterday the total teu waiting time at the hot spot port areas covered by seaexplorer stood at a staggering 11.56m days.
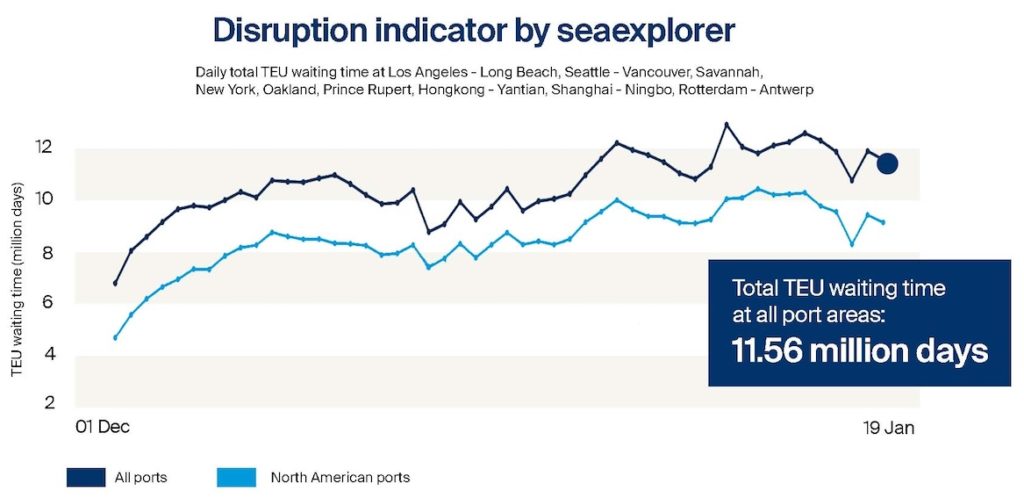
Putting this in perspective, Otto Schact, executive vice president of sea logistics at Kuehne+Nagel, observed via LinkedIn that it would only be when the indicator had dropped to less than 1m days that shippers could expect some normalcy to return to global supply chains. At that point, reliability and lead times will improve.
The indicator was created in response to client demand for a more granular approach to congestion. Shippers were asking Kuehne+Nagel repeatedly for data beyond simply the number of ships waiting off ports around the world, adding the actual waiting time including drifting and the respective capacity to come up with a meaningful indicator.
“The trend-line information provided by the indicator now enhances the ability of our customers to predict and plan for likely future impacts on their supply chain and identify the best course of action,” Schact stated.
The data is available for each carrier, each alliance, each service for the hot spot ports, with the indicator updated daily.
Splash reported earlier this month on a new index developed by the New York Federal Reserve. The Global Supply Chain Pressure Index (GSCPI) integrates a number of commonly used metrics with an aim to provide a more comprehensive summary of potential disruptions affecting global supply chains. Analysts have tracked the index back to 1997 and the data provided shows there has been no period of such supply chain pressure in the ensuing 25 years as what has been experienced over the past year.
Data from San Francisco-based freight forwarding and customs brokerage Flexport shows containers are taking twice as long to reach their destination compared to the pre-pandemic period.
Sea-Intelligence data shows that pre-pandemic typically 2% of containership capacity was caught up in delays, a figure that shot up to 11% in 2021.
While commending Kuehne+Nagel and others for adding additional data to quantify the ongoing supply chain crisis, Lars Jensen, CEO of liner consultancy Vespucci Maritime, said what the industry needed now were forward-looking tools which can predict the bottleneck problems weeks and months ahead of time rather than merely describe them as they occur.
“Such predictive capabilities will allow supply chain stakeholders to take action to prevent, or limit, the problems before they occur and in the process increase the resilience of the entire industry,” Jensen told Splash today.
Regular Splash readers may recall another popular product created by seaexplorer, its global congestion map with yesterday’s version carried below. Kuehne+Nagel data shows North American ports are responsible for approximately 80% of global disruptions at present.
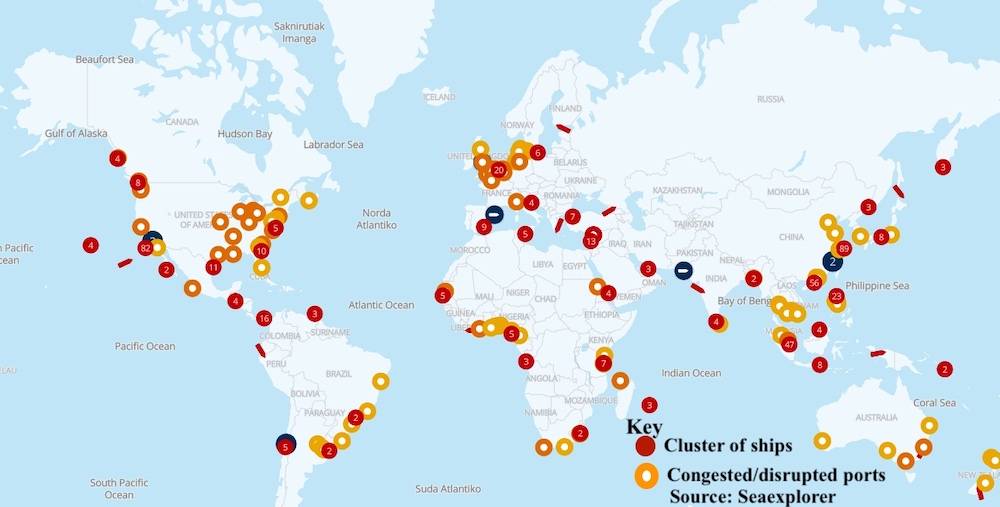
Very interesting to see the highlights that north american ports are responsible for approx 80% of global disruptions. Yes we probably all know about the queue of boats outside LA / LB which is extreme, but i expected delays from China, Europe, Indian sub-continent and other ares to contribute a lot more here? Perhaps things aint all that bad for us europeans! 🙂
I have developed a solution that can reduce container inventory management by 20%. Would like to see if we can move this activity forward at commercial level. At present l have applied for patent.