
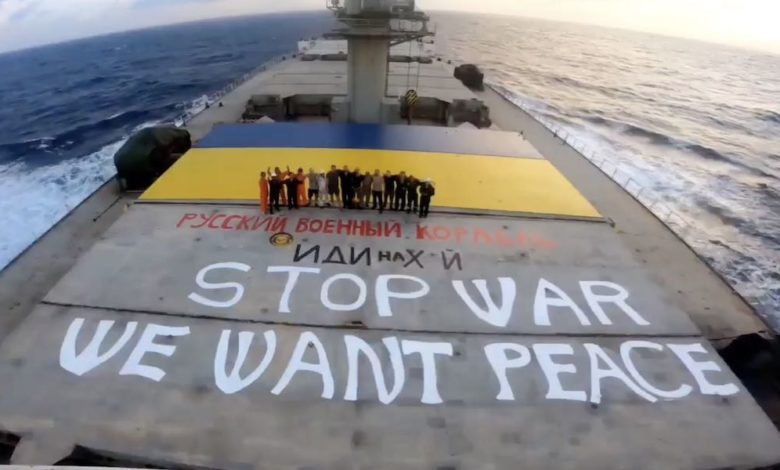
3.40 am Kyiv time a year ago. War started by air, land, and sea. Immediately global trade suffered dislocations that have swollen over the ensuing 12 months with no end in sight to the combat between Ukraine and Russia.
Seafarers have died in the crossfire around the Black Sea, many more have been pressed into service on the ground in Ukraine, and global shipping is braced for accidents as vintage vessels join the fast-growing dark fleet, trading under the radar with worrying safety concerns.
Nevertheless, ships continue to deliver their cargoes, often much further away than before; the inefficiency pushing rates up for many sectors including LNG, crude, and product tankers.
As an industry, shipping had learned to be more flexible and collaborative during the covid pandemic, useful lessons that carried through in the wake of war breaking out in eastern Europe.
“When the war in Ukraine began, it was these qualities that meant our industry could mobilise quickly to tackle the challenges the industry faced. This included ensuring that seafarers impacted could be paid, ensuring that any sanctions did not inappropriately target shipowners, and engaging at the highest levels to support the development of the grain corridor,” Guy Platten, the secretary-general of the International Chamber of Shipping, told Splash today.
For Dr Martin Stopford, the world’s most famous maritime economist, the war has not been a game changer per se for shipping.
“It’s been more of an addition to the many disruptions caused by the pandemic and its aftermath,” said Stopford, the author of Maritime Economics.
Tankers and LNG carriers have enjoyed very solid returns since war began.
In January 2022, just before the war started, crude earnings had plunged to $5,000 a day. But once the war got started, they surged, with strong spikes in the second and fourth quarters of 2022, with earnings averaging over $40,000 a day over the past 12 months.
“This has been almost exclusively a tanker market story,” commented Roar Adland, shipping professor at the Norwegian School of Economics, a protégé of Stopford’s from their days together at Clarksons Research.
“The past 12 months have highlighted once again how disruption is good from the viewpoint of shipowners. If you mess with an extremely efficient market by introducing constraints – either self-imposed or political sanctions – then the resulting supply-side inefficiencies and freight rate hikes can be substantial,” Adland added.
Prices for tankers to keep Russian exports moving beyond the sanctions raining in have leaped. Clarkson Research’s secondhand tanker price index has recorded its sharpest-ever upwards movement over the last year, rising by 52% to the highest level since 2008.
“Russian crude oil production and seaborne exports have proved very resilient,” said Dag Kilen, head of research at Norwegian broker Fearnleys.
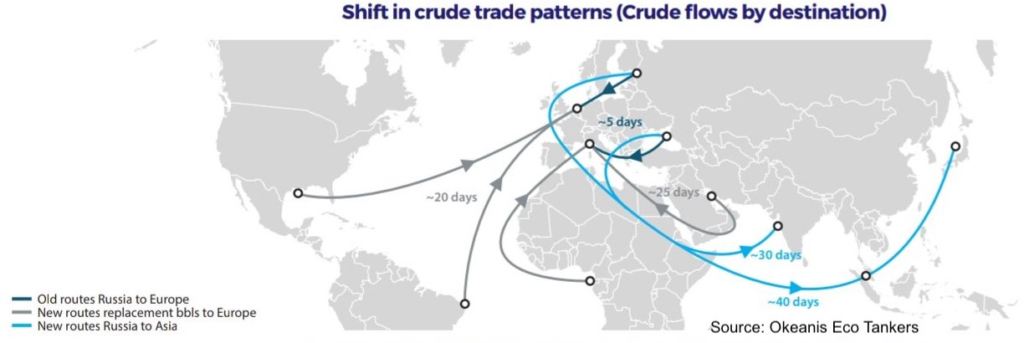
An average 3.21m barrels per day was loaded over the past 12 months, versus an average 3.06m barrels per day during the previous 12-month period, according to data from Fearnleys. This excludes Kazak Kebco and CPC grades loaded at Novorossiysk. Volumes to Europe started to decline shortly after the war broke out and were already limited by the time of the December 5 price cap. The vast majority of ton-mile changes relating to Russian seaborne crude oil flows were therefore witnessed last year.
The biggest shift was in volumes heading to Asia, where an average 1.93m barrels per day has ended up over the past 12 months versus 1.04m barrels per day in the previous 12-month period, Fearnleys data shows. Excluding Russia Far East, originating volumes to Asia would show 985,000 barrels per day in the past 12 months versus 102,000 in the previous period, hence around 880,000 barrels per day of Baltic and Black Sea volumes have been boosting the average distance tankers travel.
India has been the most eager buyer, accounting for 829,000 barrels per day of what has been loaded of Russian crude oil over the past year, compared with only 31,000 barrels per day during the 12-month period before the war broke out. China has taken a fair bit more with the past year showing 994,000 barrels per day versus 700,000 loaded in Russian ports a year earlier.
Volumes of clean oil products, predominantly diesel/gasoil and naphtha, have also been resilient at around 1.6m barrels per day, with volumes reaching as high as 1.9m barrels per day over the past two months, leading up to the February 5 price cap on oil products. An average 266,000 barrels per day has been loaded for European destinations after the February 5 price cap, versus an average 908,000 barrels per day during the period from when the war broke out until the price cap came into effect. Europe has shifted much of its sourcing from Russia to suppliers east of Suez, while Russian clean products now seek new homes in Asia and Africa predominantly.
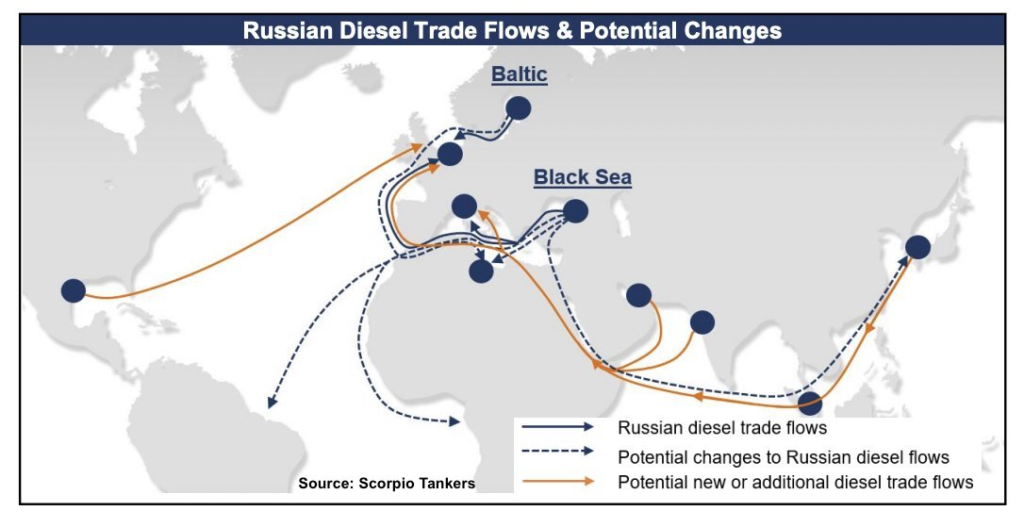
For dirty oil products, fuel oil predominantly, volumes have been around 870,000 barrels per day the past 12 months versus 1.1m barrels per day during the previous 12-month period. 31% of the past 12-month loadings has been for Europe while 4% has been for the US, versus 49% and 30% respectively during the previous 12-month period until the war broke out. While only 12% was shipped to Asia and 4.6% shipped to the Middle East during the previous 12-month period, this has changed to 42% and 15.4% respectively for the past 12-month period, according to Fearnleys.
In gas, as Europe lost pipeline volumes from Russia, down 55% year-on-year, LNG had to cover what increased North Sea piped volumes were unable to compensate for to Europe. LNG flows to Europe grew 70% year-on-year, according to Fearnleys.
It was primarily US LNG that came to Europe’s rescue, as around 61% of the US LNG cargoes ended in Europe, up from around 25% of the cargoes originating in the US to Europe in 2021. A similar trend was seen for Yamal LNG cargoes during the Northern Sea Route season.
“Weaker Chinese and Asian demand sort of saved Europe, one could say,” commented Kilen from Fearnleys, adding: “With China reopening, Europe short of even more piped gas this year, and new liquefaction capacity being limited for a third year in a row, it could be another tight autumn on LNG availability as European buyers will have to compete more with Asian buyers, although a restart of Freeport LNG should help.”
For the ammonia trades, the loss of Ukrainian exports marked a significant shift in the global seaborne map.
The port of Yuzhny in Ukraine was prior to the war one of the top suppliers of ammonia to the world market, accounting for around 11% of seaborne traded volumes in 2021. No shipments have been done after the war broke out, resulting in higher fertilizer prices and fear of food shortages. Much of the shortfall has however been covered by other suppliers, with seaborne traded volumes of ammonia declining just a moderate -2.1% in 2022 versus 2021. Although the top producer Trinidad & Tobago also produced less last year, this was more than compensated for through higher exports from other leading suppliers, such as Saudi Arabia, Indonesia and Algeria.
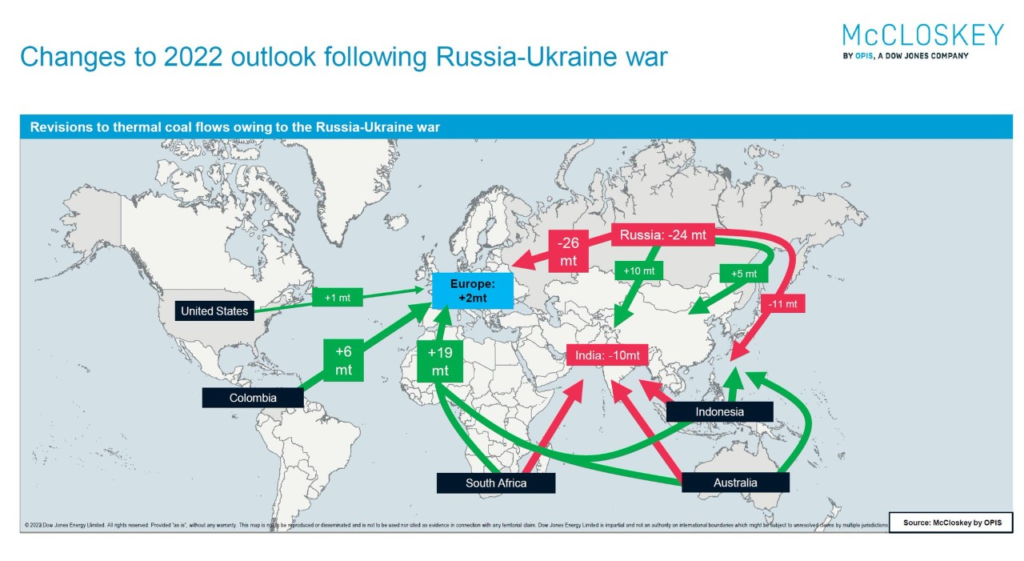
For dry bulk, coal and grain were the headline changes in the 12 months of war.
As Europe banned Russian-originated coal, imports from Australia and South Africa reached the highest level in at least 10 years last year. There was also a significant increase in imports from Colombia and the US on 2021 levels, whereas minor increases were also seen from Indonesia and Mozambique.
The Russian volumes that previously went to Europe were sold in increasing quantities to China, India, South Korea, and Turkey. Due to longer sailing distances along with the second-highest annual shipment volumes ever, coal ton-time reached all-time highs last year, according to Fearnleys.
On the grains side, Ukraine’s usual buyers had to source from other countries. However, this was and is almost impossible, which meant there was no significant shift in trade flows apart from volumes being lost.
Ukraine’s dry bulk exports have plunged 77.8% during the first year of war with Russia, data from BIMCO shows. Prior to the war, more than one-tenth of the world’s wheat and maize shipments came from Ukraine.
“There is no indication that an end to the war will lead to a resurgence in global growth,” warned Niels Rasmussen, chief shipping analyst at BIMCO.
“The lower than previously expected growth in 2022 and following years will therefore have a lasting impact also on growth in shipping markets,” Rasmussen predicted, adding: “In addition, the war again elevated energy supply to a matter of national security, particularly in the EU. It has led to a renewed commitment to accelerate decarbonisation which will have a lasting impact on coal and oil shipments.”
With the last word on the first year anniversary of the war and its impact on shipping, in typically understated fashion, Stopford has this to say: “So, after a year, the Ukraine war looks like another campaign badge for battle-weary shipowners to add to their collection – another day, another dollar.”
“and global shipping is braced for accidents as vintage vessels join the fast-growing dark fleet” … are you sure vintage is the right word? Typically, a vintage car is well cared for, whereas wrecks and junkers aren’t.